Reason for the analysis
COVID-19 has created a new normal for people around the world. Everywhere you turn there is new information regarding some aspect of the virus or personal stories of what the virus has done. Online there is story after story of different takes on the impact of what the virus has done and what needs to be done next.
With the misinformation that has been stated and the different feelings toward the virus, I wanted to look at the data from the CDC myself and investigate questions that I have. The research and analysis in this article has been mine and mine alone.
Process Used
The Data
The data set was originally downloaded from https://data.cdc.gov/Case-Surveillance/COVID-19-Case-Surveillance-Public-Use-Data/vbim-akqf as a csv file. This data is what is given to the public and can be freely downloaded from the CDC’s website. It was last updated on November 24, 2020 as of the writing of this article. The CDC data that will be used in this analysis will be lab confirmed cases from 2020-01-01 to 2020-09-30.
A description of the data in the csv would be as follows:
Key
- field – description
- type of data or possible values
Fields in the csv data
- cdc_report_dt – Initial case report to CDC
- date format 2020/09/15
- pos_spec_dt – Date of first positive specimen collection
- date format 2020/09/15
- onset_dt – Date at which the person started showing symptoms
- date format 2020/09/15
- current_status – Case status
- Laboratory-confirmed case
- Probable Case
- sex – Gender of the person
- Female
- Male
- Unknown
- Missing
- Other
- NA
- age_group – The age group the person belonged to
- 0 – 9 Years
- 10 – 19 Years
- 20 – 29 Years
- 30 – 39 Years
- 40 – 49 Years
- 50 – 59 Years
- 60 – 69 Years
- 70 – 79 Years
- 80+ Years
- NA
- Unknown
- Race and ethnicity (combined)
- Unknown
- Asian, Non-Hispanic
- Multiple/Other, Non-Hispanic
- Black, Non-Hispanic
- Hispanic/Latino
- American Indian/Alaska Native, Non-Hispanic
- Native Hawaiian/Other Pacific Islander, Non-Hispanic
- White, Non-Hispanic
- NA
- hosp_yn – Was the person hospitalized?
- No
- Missing
- Yes
- Unknown
- icu_yn – Was the patient admitted to an intensive care unit?
- Unknown
- Yes
- Missing
- No
- death_yn – Did the person die as a result of coronavirus?
- Missing
- Unknown
- Yes
- No
- medcond_yn – Did they have any underlying medical conditions and/or risk behaviors?
- Yes
- Unknown
- No
- Missing
Processing
The csv file was read into a MySQL database with python. Queries were constructed to pull desired data. Excel was used for visuals. Blank dates were stored as 2019-01-01.
My Questions
When was the first lab confirmed case?
The data shows that the first lab confirmed case was on 2020-01-01. This seems odd to me since I can remember first feeling alarmed when a cruise ship was trying to dock in California in March. However, I do remember China having a lot of trouble with the virus in December.
There were 8 people who were lab confirmed on 2020-01-01.
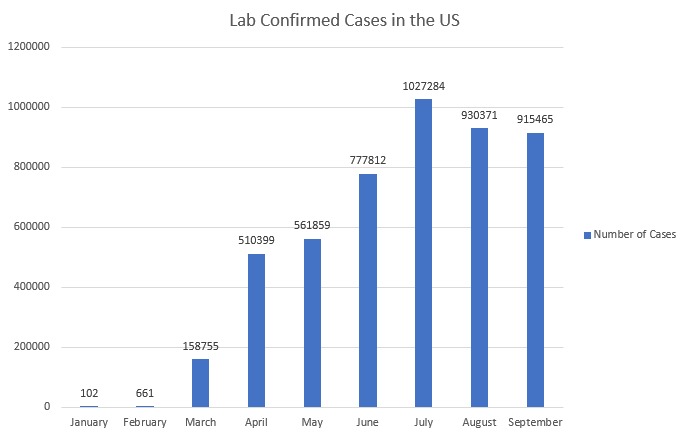
How many cases per month?
Below is a table of the number of cases per month in the United States.
| Month | Number of Cases |
|---|---|
| January | 102 |
| February | 661 |
| March | 158,755 |
| April | 510,399 |
| May | 561,859 |
| June | 777,812 |
| July | 1,027,284 |
| August | 930,371 |
| September | 915,465 |
This is a bar chart of the table above to get another perspective.
How many deaths per month?
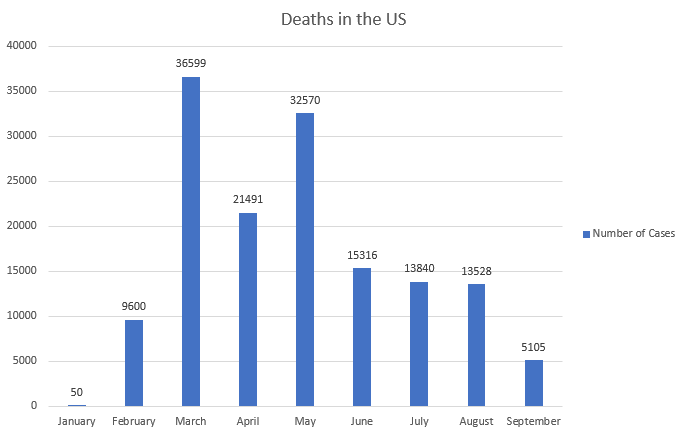
Below is a table of the number of deaths per month in the US.
| Month | Number of Deaths |
|---|---|
| January | 0 |
| February | 50 |
| March | 9,600 |
| April | 36,599 |
| May | 21,491 |
| June | 32,570 |
| July | 15,316 |
| August | 13,840 |
| September | 13,528 |
This is a bar chart of the table above.
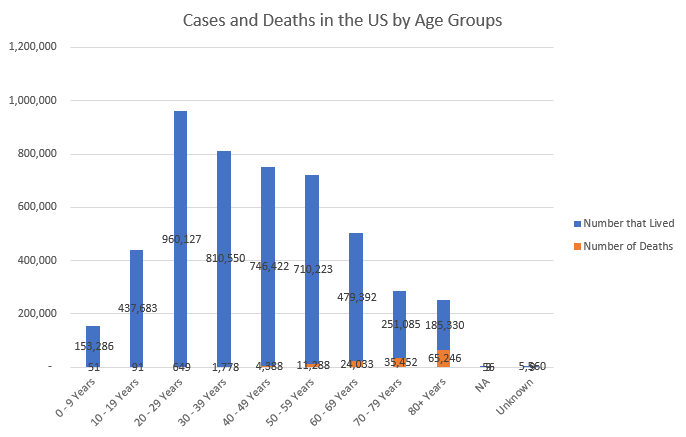
How many people have died from COVID-19 per age group?
Up to and through September, there have been 4,882,708 lab confirmed cases of COVID-19. Of those cases, 142,994 have died. This means that overall 2.93% have died from COVID-19 while 97.07% have lived.
| Age Group | Number of Cases | Cases where the person died | % that died | % that lived |
|---|---|---|---|---|
| 0 – 9 Years | 153,337 | 51 | .33% | 99.67% |
| 10 – 19 Years | 437,774 | 91 | .02% | 99.98% |
| 20 – 29 Years | 960,776 | 649 | .07% | 99.93% |
| 30 – 39 Years | 812,328 | 1,778 | .22% | 99.78% |
| 40 – 49 Years | 750,810 | 4,388 | .58% | 99.42% |
| 50 – 59 Years | 721,511 | 11,288 | 1.56% | 98.44% |
| 60 – 69 Years | 503,425 | 24,033 | 4.77% | 95.23% |
| 70 – 79 Years | 286,537 | 35,452 | 12.37% | 87.63% |
| 80+ Years | 250,576 | 65,246 | 26.04% | 73.96 |
| NA | 65 | 9 | 13.85% | 86.15% |
| Unknown | 5569 | 9 | .16% | 99.84% |
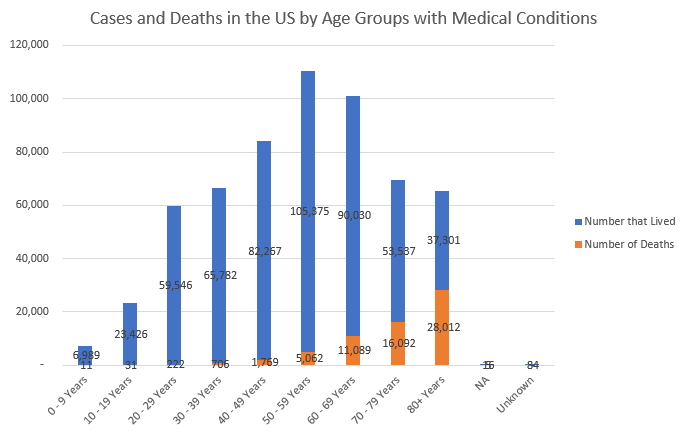
Of the people who had medical conditions, what percent died and lived?
Up through the month of September, there have been 587,352 lab confirmed cases with underlying medical conditions. Of those cases, 62,999 died. This means 10.73% (62999/587352 = .1073) who have been diagnosed with COVID-19 with underlying medical conditions have died from COVID-19. This, also, means that 89.27% (100% – 10.73% = 89.27%) have lived.
This table breaks this down for each age group.
| Age Group | Cases with medical conditions | Cases with medical conditions that died | % that died | % that lived |
|---|---|---|---|---|
| 0 – 9 Years | 7,000 | 11 | .16% | 99.84% |
| 10 – 19 Years | 23,457 | 31 | .13% | 99.87% |
| 20 – 29 Years | 59,768 | 222 | .37% | 99.63% |
| 30 – 39 Years | 66,488 | 706 | 1.06% | 98.94% |
| 40 – 49 Years | 84,036 | 1,769 | 2.11% | 97.89% |
| 50 – 59 Years | 110,437 | 5,062 | 4.58% | 95.42% |
| 60 – 69 Years | 101,119 | 11,089 | 10.97% | 89.03% |
| 70 – 79 Years | 69,629 | 16,092 | 23.11% | 76.89% |
| 80+ Years | 65,313 | 28,012 | 42.89% | 57.11% |
| NA | 21 | 5 | 23.81% | 76.19% |
| Unknown | 84 | 0 | 0% | 100% |
As a side note, I wanted to point out that the survivors of COVID-19 have reported of having lasting symptoms that have reduced their quality of life like a loss of smell and scarring on their heart.
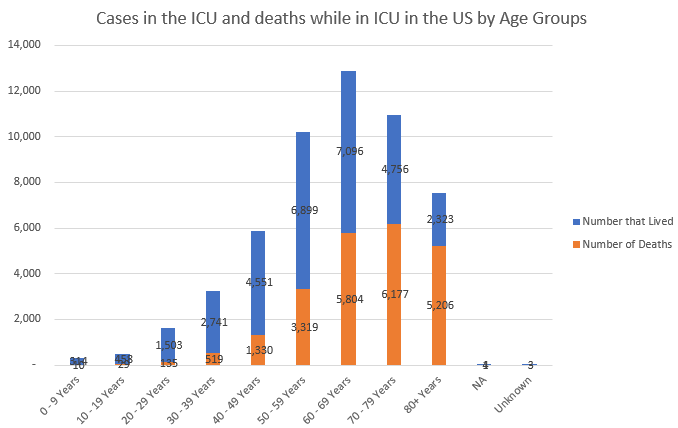
If a person was in the ICU, what percent died and lived?
Out of the 53,178 of people who were reported as being in the ICU, 22,533 died. This means that 42.37% died from COVID-19 if they were in the ICU while 57.63% lived.
This is a table that breaks down the data by age groups.
| Age Group | People who have been in the ICU | People who have died and were in the ICU | % that died | % that lived |
|---|---|---|---|---|
| 0 – 9 Years | 324 | 10 | 3.09% | 96.91% |
| 10 – 19 Years | 487 | 29 | 5.95% | 94.05% |
| 20 – 29 Years | 1,638 | 135 | 8.24% | 91.76% |
| 30 – 39 Years | 3,260 | 519 | 15.92% | 84.08% |
| 40 – 49 Years | 5,881 | 1,330 | 22.62% | 77.38% |
| 50 – 59 Years | 10,218 | 3,319 | 32.48% | 67.52% |
| 60 – 69 Years | 12,900 | 5,804 | 44.99% | 55.01% |
| 70 – 79 Years | 10,933 | 6,177 | 56.50% | 43.5% |
| 80+ Years | 7,529 | 5,206 | 69.15% | 30.85% |
| NA | 5 | 4 | 80% | 20% |
| Unknown | 3 | 0 | 0% | 100% |
What percent of the cases have not showed symptoms?
Unfortunately, the data seemed to be showing missing information from the queries that I performed. For example, it doesn’t make sense that 64,625 people who did not have a date of when they started to show symptoms are marked as being killed by COVID-19. I speculate that they did not know when the symptoms started and did not report a date.
In order to attempt to get something of an answer, I only considered records with definite values in every field. This resulted in there being 0 asymptomatic cases out of the 169,810 records I felt like I could use. Maybe, this can be answered in a future version of the data.
How many males and how many females have tested positive?
The data showed that there were 2,319,228 (48.05%) cases from males and 2,507,626 (51.95%) cases from females.
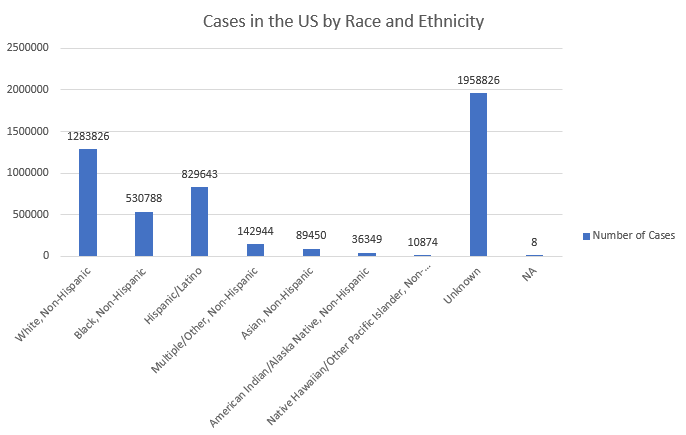
What is the total number of cases for each race and ethnicity?
| Race and Ethnicity | Number of Cases |
|---|---|
| White, Non-Hispanic | 1,283,826 |
| Hispanic/Latino | 829,643 |
| Black, Non-Hispanic | 530,788 |
| Multiple/Other, Non-Hispanic | 142,944 |
| Asian, Non-Hispanic | 89,450 |
| American Indian/Alaska Native, Non-Hispanic | 36,349 |
| Native Hawaiian/Other Pacific Islander, Non-Hispanic | 10,874 |
| Unknown | 1,958,826 |
| NA | 8 |
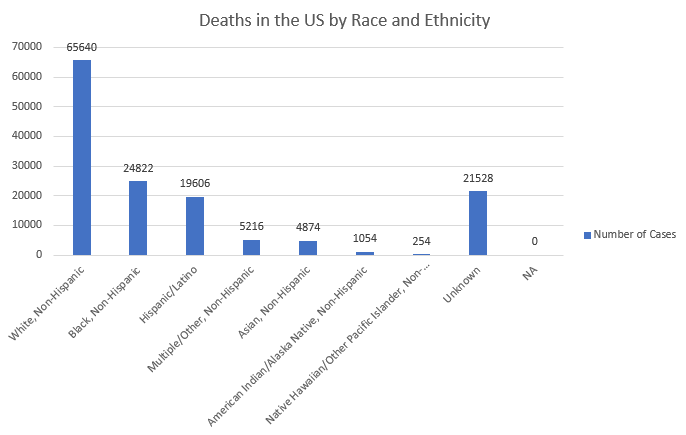
What is the total number of deaths for each race and ethnicity?
| Race and Ethnicity | Number of Deaths |
|---|---|
| White, Non-Hispanic | 65,640 |
| Black, Non-Hispanic | 24,822 |
| Hispanic/Latino | 19,606 |
| Multiple/Other, Non-Hispanic | 5,216 |
| Asian, Non-Hispanic | 4,874 |
| American Indian/Alaska Native, Non-Hispanic | 1,054 |
| Native Hawaiian/Other Pacific Islander, Non-Hispanic | 254 |
| Unknown | 21,528 |
| NA | 0 |
Thoughts
There are still a lot that we don’t know about COVID-19 that can change how we should treat the virus. These are some questions and thoughts that I have:
- Can a person be infected by COVID-19 after they have been infected and survived?
- If this is true, it seems less effective to me to report the total number of cases since a person could be counted twice. At that point, reporting active cases would show how prevalent the virus is.
- What are the long term effects of COVID-19?
- This one is especially interesting since it affects the quality of life of the person but may go under the radar if the symptoms are subtle.
- Are there more than one strain of COVID-19?
- What should we learn from living through this pandemic?
If there are other questions that you would like to know from the data or if you would want me to update my answers to my questions with up-to-date data, let me know in the comments.
Thanks for your support.
